Traces view explained
How to Use the Traces View in the Customer Portal
As a Market Data API provider, our Traces view in the Customer Portal offers a detailed overview of API call traces. This guide will walk you through using the Traces view to inspect and analyze API requests and responses.
Navigating to the Traces View
- Login to the Customer Portal: Ensure you are logged in to the CoinAPI.io Customer Portal.
- Access Traces: From the main menu on the left side, locate and click on "Traces" under the "API Keys" section.
Filtering Traces
The Traces view allows you to filter the API call traces based on time and HTTP status.
Time Filter
Select the desired time range for viewing the traces:
- Last 5 minutes
- Last 15 minutes
- Last 1 hour
- Last 4 hours
- Last 24 hours
HTTP Status Filter
Choose the HTTP status to filter the traces:
- All
- Success
- Client Error
- Server Error
- Viewing Traces
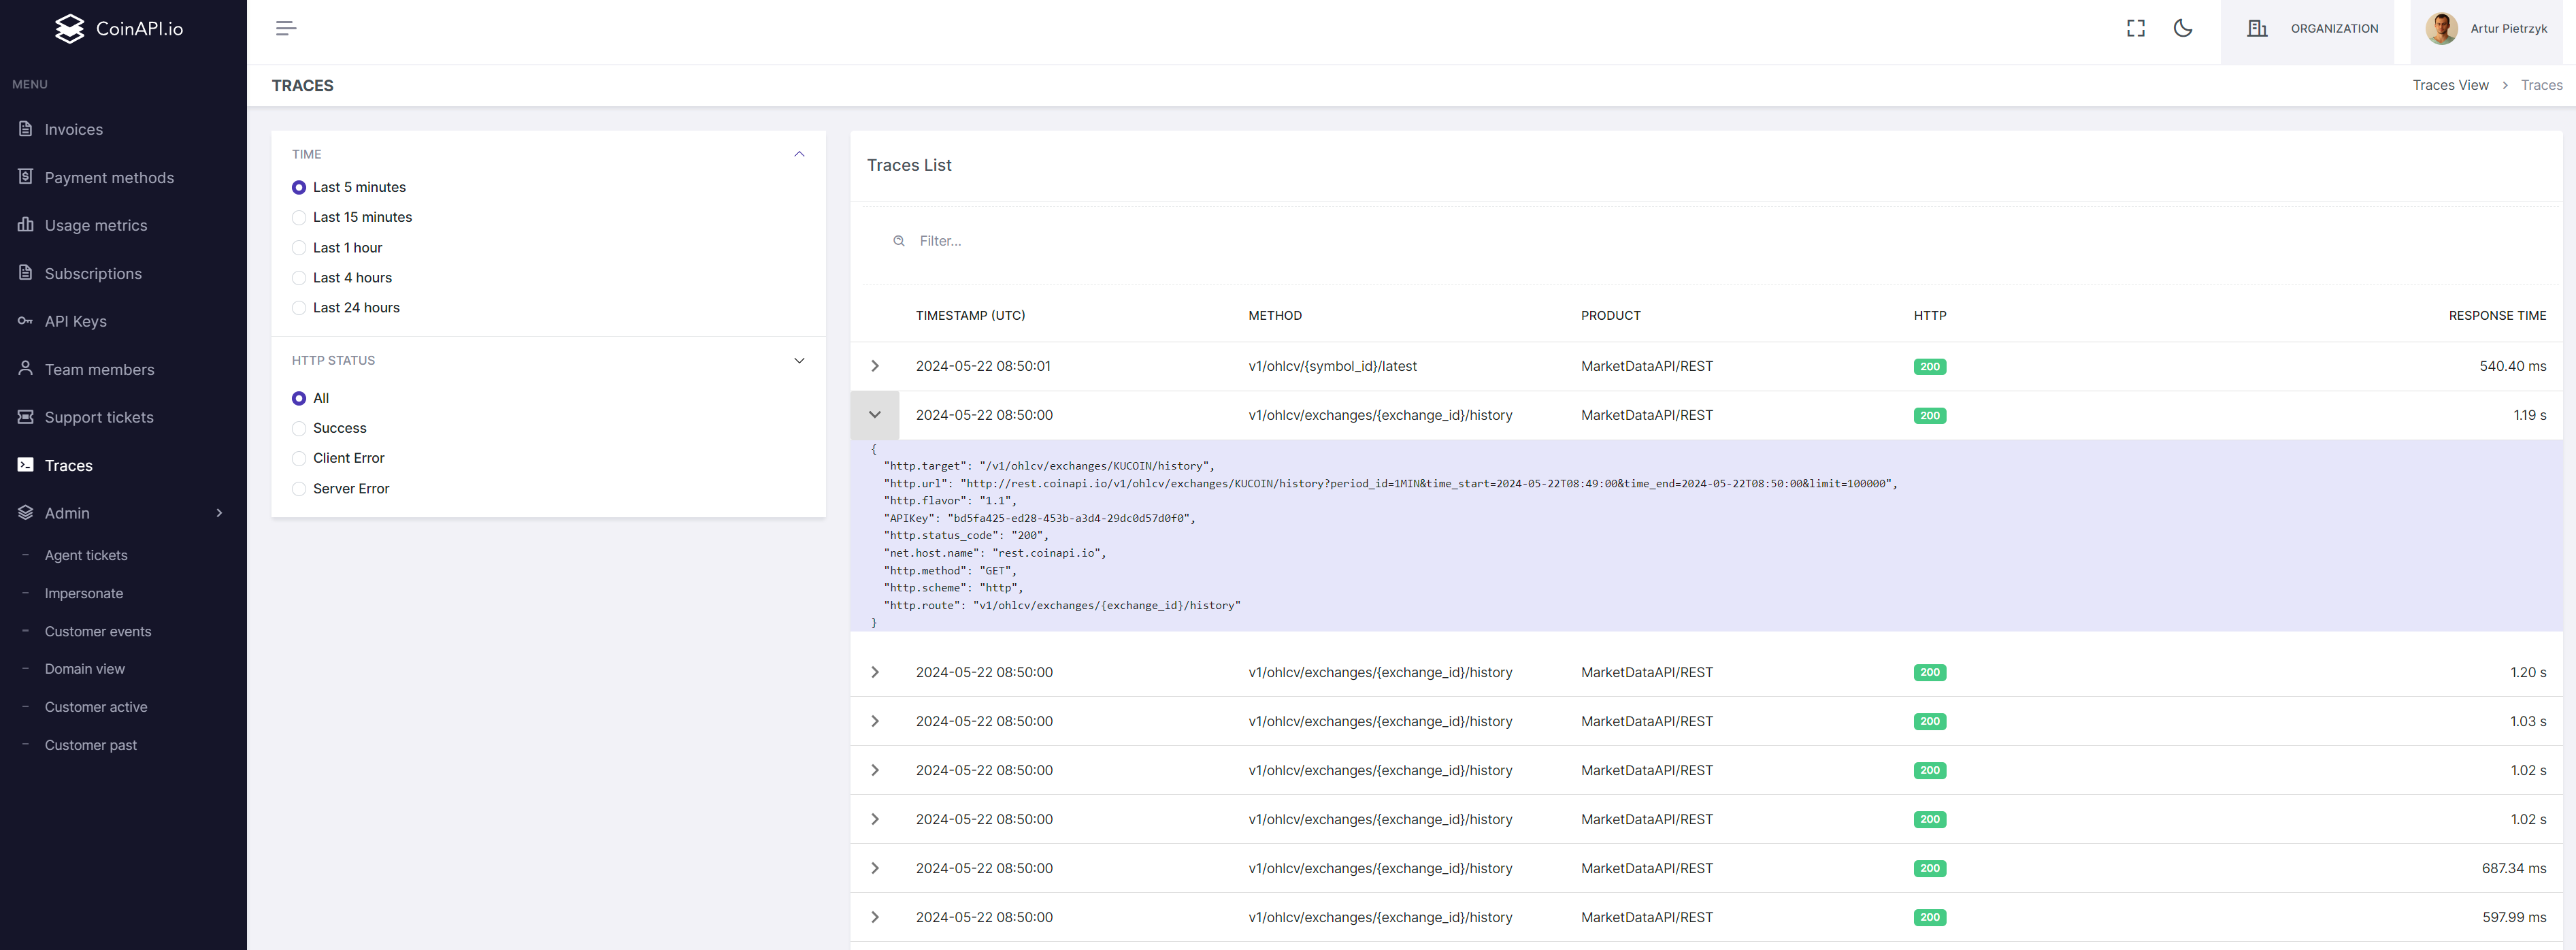
The Traces List displays the details of each API call trace. Each trace entry includes the following information:
- Timestamp (UTC): The exact time when the API call was made.
- Method: The API method used (e.g.,
v1/ohlcv/{symbol_id}/latest). - Product: The specific API product used (e.g., MarketDataAPI/REST).
- HTTP Status: The HTTP response status code (e.g., 200).
- Response Time: The time taken to get a response for the API call.
To view detailed information about a specific trace:
Click on the arrow next to the trace entry. A detailed JSON view of the trace will expand, displaying the following fields:
- http.target: The target endpoint of the API call.
- http.url: The full URL of the API request.
- http.flavor: The HTTP version used.
The API key used for the request:
- http.status_code: The HTTP status code of the response.
- net.host.name: The hostname of the API server.
- http.method: The HTTP method used (GET, POST, etc.).
- http.scheme: The scheme used for the request (http, https).
- http.route: The route pattern of the API endpoint.
Example
Below is an example of a trace entry in the expanded view:
{
  "http.target": "/v1/ohlcv/exchanges/KUCOIN/history",
  "http.url": "http://rest.coinapi.io/v1/ohlcv/exchanges/KUCOIN/history?period_id=1MTH&time_start=2024-05-22T08:49:00&time_end=2024-05-22T08:50:00&limit=100000",
  "http.flavor": "1.1",
  "APIKey": "bd5fa425-ed28-453b-a34d-29dc8d57d0f0",
  "http.status_code": 200,
  "net.host.name": "rest.coinapi.io",
  "http.method": "GET",
  "http.scheme": "http",
  "http.route": "/v1/ohlcv/exchanges/{exchange_id}/history"
}
This information helps in debugging and understanding the behavior of the API calls, providing insights into any issues or performance metrics.
Conclusion
The Traces view in the Customer Portal is a powerful tool for monitoring and analyzing API calls. By using the filters and detailed trace information, you can efficiently troubleshoot and optimize your API usage.